Introduction
GraphViz is an open-source software package developed by AT&T Labs for generating directed graphs and flowcharts. Outputs are created using Dot, a plain text graph description language that is part of the Graphviz package. GraphViz is a powerful application that allows users to create appealing flowcharts without getting hung up on the layout or positioning of the nodes. Graphs in GraphViz are comprosed of nodes and edges (lines), and can be directed (lines with arrows) or undirected (lines without arrows). To create flowcharts with dot, the user must specify the type of graph, the name of the plot, and then define the terms of the graph within braces.
Basics
To generate visualizations using Graphviz, a user must create a dot source file and save it with a .dot extension. In the terminal, set the current working directory to the location of that file and launch dot by running ‘dot -T png -O file_name.dot’.
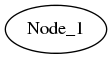
Example One:
graph name1 {
     Node1 [label="Node_1"];
}
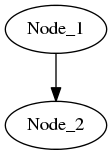
Example Two:
digraph name1 {
      Node1 [label="Node_1"];
      Node2 [label="Node_2"];
      Node1 -> Node2;
}

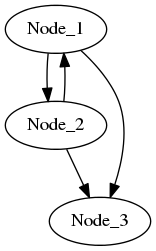
Example Three:
digraph name1 {
     Node1 [label="Node_1"];
     Node2 [label="Node_2"];
     Node3 [label="Node_3"];
     Node1 -> Node2 -> Node3;
     Node1 -> Node3;
     Node2 -> Node1;
}
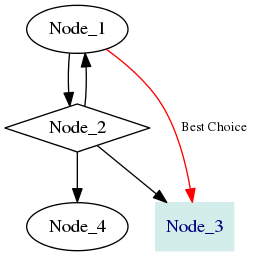
Example Four:
digraph name1 {
   Node1 [label="Node_1"];
   Node2 [label="Node_2", shape=diamond];
   Node3 [label="Node_3", color=Blue, fontcolor=Navy, shape=box, style=filled,
               color="#d3edea"];
   Node4 [label="Node_4"];
   Node1 -> Node2 -> Node3;
   Node1 -> Node3 [color=red, label="Best Choice", fontsize=10];
   Node2 -> Node1;
   Node2 -> Node4;
}