While recently looking at submissions for H1B Visas, I noticed that a not insignificant number of companies had submitted proposals to receive visas for persons who would be working as recruiters. While I know very little about the labor maket for recruiters, I wanted to examine that data to see which companies were applying for those visas and what they were paying. The data indicates that most of these visa proposals come from recruitment agencies and the overwelming amount of these roles pay very little. I’m really not sure why or how the government is allowing companies to grant H1B visas for people who would be working as recruiters given that a large number of American citizens are capable of doing those jobs. This seems like another areas where there is rampant fraud in the H1B visa program.
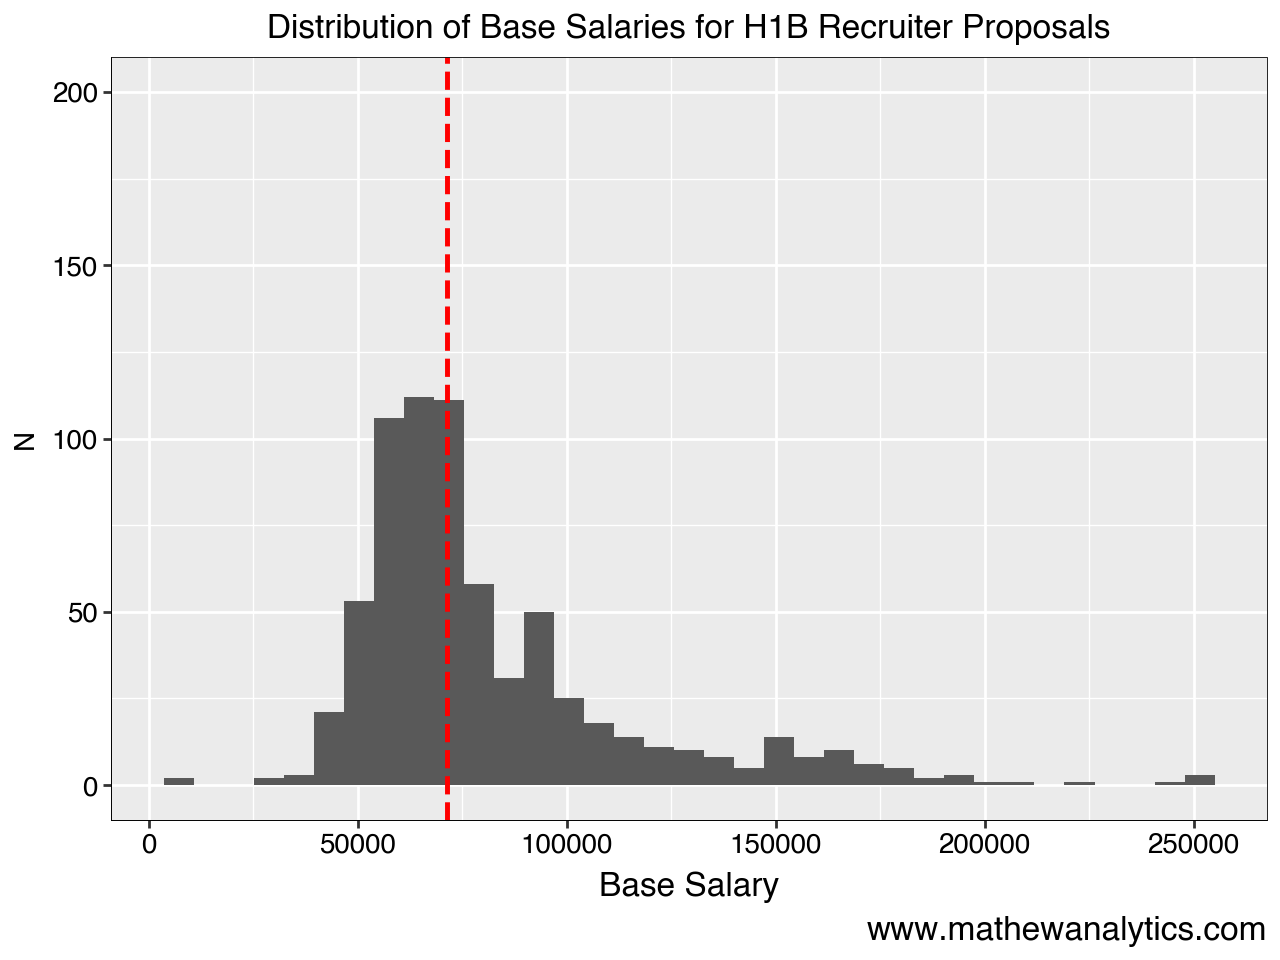
Distribution of H1B Recuiter Base Salaries
The median salary for these recruiter H1B proposals is $71,448. That is an extremely low value given that it is not necessarily a specialized occupation and many Americans are already able to do the job with limited to no training. Furthermore, the distribution suggests an extreme right tail where very few make extremely high salaries.
from plotnine import *

df["base_salary"] = pd.to_numeric(df["base_salary"].str.replace(r"[^\d.]", "", regex=True), errors="coerce")

median_salary = df["base_salary"].median()

plot = (
    ggplot() +
    geom_histogram(df, aes(x="base_salary")) +
    ylim(0,200) +
    geom_vline(xintercept=median_salary, color="red", linetype="dashed", size=1) +
    labs(
        title="Distribution of Base Salaries for Recruiter H1B Proposals",
        x="Base Salary",
        y="N",
        caption='www.mathewanalytics.com'
        ) +
    labs(caption = "www.mathewanalytics.com") +
    # scale_y_continuous(limits=(0, 500)) +
    theme(
        plot_title=element_text(size=12, weight='bold', color='black'),
        axis_title_x=element_text(size=12, weight='bold', color='black'),
        axis_title_y=element_text(size=10, weight='bold', color='black'),
        axis_text_x=element_text(size=10, weight='bold', color='black'),
        axis_text_y=element_text(size=10, weight='bold', color='black'),
        strip_text_x=element_text(size=10, weight='bold', color='black'),
        strip_text_y=element_text(size=10, weight='bold', color='black'),
        axis_line=element_line(color='black', size=0.3),
        panel_border=element_rect(color='black', fill=None, size=0.3),
        plot_caption=element_text(size=12, weight='bold')
    )
)


print(plot)
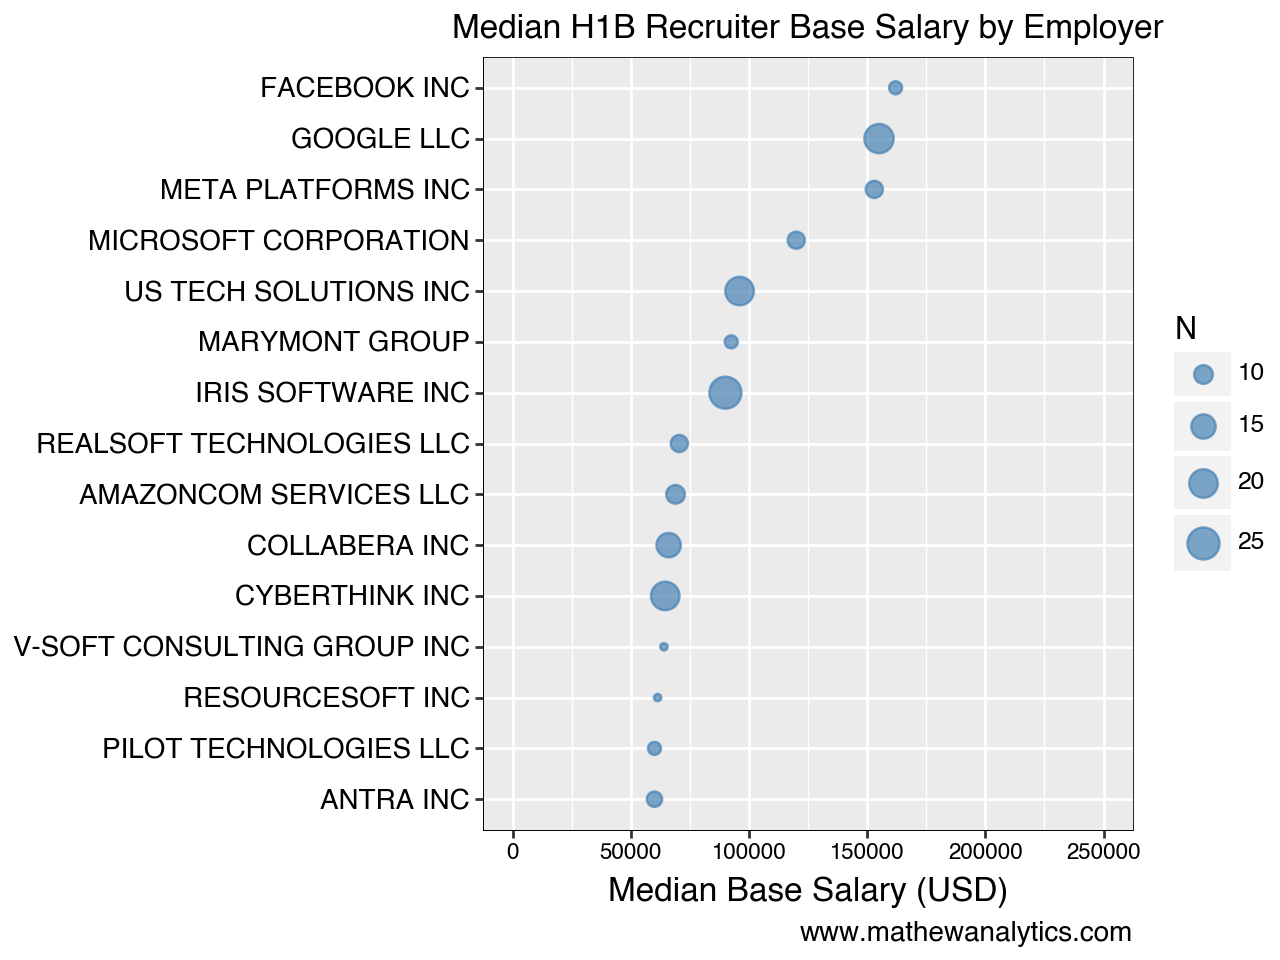
Median H1B Recruiter Base Salaries by Employer
The highest paid recruiters on H1B visa are generally at the top tech companies. One would suspect these are likely working on technical recruitment. Beyond that it is a bunch of recruitment agencies and they pay nothing. If I were a government official, these are the type of fraudulent H1B visas that I want to stop as they are less specialized and pay nothing.
employer_summary = (
    df.groupby("employer")
      .agg(
          N=("base_salary", "size"),
          median_base_salary=("base_salary", "median")
      )
      .reset_index()
)

employer_summary = employer_summary[employer_summary["N"] > 5]

employer_summary = employer_summary.sort_values("median_base_salary", ascending=True)

employer_summary["employer"] = pd.Categorical(
    employer_summary["employer"],
    categories=employer_summary["employer"],
    ordered=True
)

plot = (
    ggplot(employer_summary, aes(x="employer", y="median_base_salary", size="N")) +
    geom_point(alpha=0.7, color="steelblue") +
    labs(
        title="Median Recruiter H1B Base Salary by Employer",
        x="",
        y="Median Base Salary (USD)",
        caption="www.mathewanalytics.com"
    ) +
    ylim(0, 250000) +
    theme(
        plot_title=element_text(size=12, weight='bold', color='black'),
        axis_title_x=element_text(size=12, weight='bold', color='black'),
        axis_title_y=element_text(size=10, weight='bold', color='black'),
        axis_text_x=element_text(size=8, color='black'),
        axis_text_y=element_text(size=10, color='black'),
        axis_line=element_line(color='black', size=0.3),
        panel_border=element_rect(color='black', fill=None, size=0.3),
        plot_caption=element_text(size=10, weight='bold')
    ) +
    coord_flip()
)

print(plot)
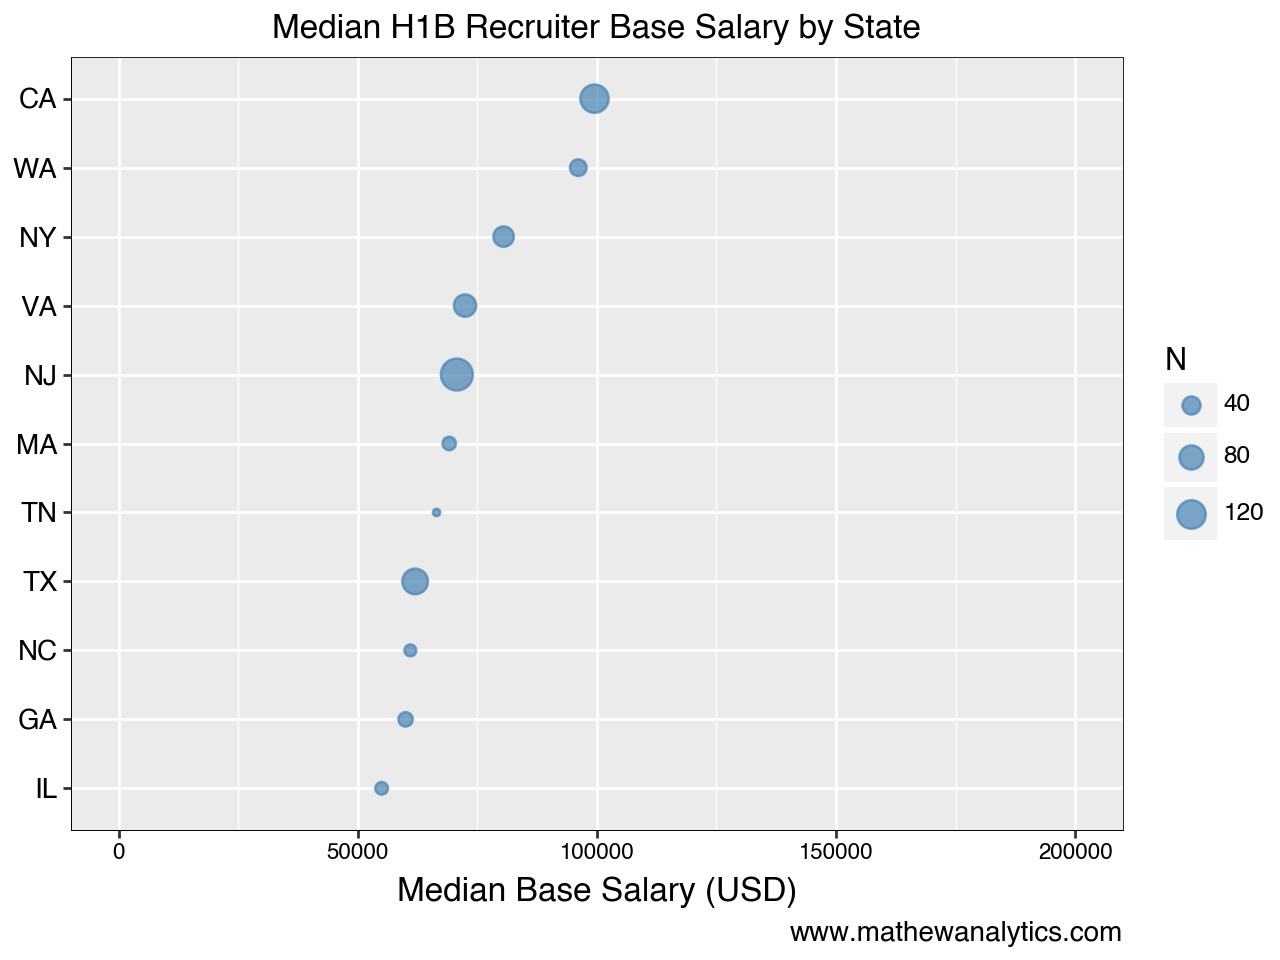
Median H1B Recruiter Base Salaries by State
The highest paid recruiters on H1B visa are generally located in the states with the largest economic centera. When looking at median H1B salaries by states, these definitely seem extremely low.
df["location_state"] = df["location"].str.split(",").str[-1].str.strip()

employer_summary = (
    df.groupby("location_state")
      .agg(
          N=("base_salary", "size"),
          median_base_salary=("base_salary", "median")
      )
      .reset_index()
)

employer_summary = employer_summary[employer_summary["N"] >10]

employer_summary = employer_summary.sort_values("median_base_salary", ascending=True)

employer_summary["location_state"] = pd.Categorical(
    employer_summary["location_state"],
    categories=employer_summary["location_state"],
    ordered=True
)

# Plot
plot = (
    ggplot(employer_summary, aes(x="location_state", y="median_base_salary", size="N")) +
    geom_point(alpha=0.7, color="steelblue") +
    labs(
        title="Median H1B Recruiter Base Salary by State",
        x="",
        y="Median Base Salary (USD)",
        caption="www.mathewanalytics.com"
    ) +
    ylim(0, 200000) +
    theme(
        plot_title=element_text(size=12, weight='bold', color='black'),
        axis_title_x=element_text(size=12, weight='bold', color='black'),
        axis_title_y=element_text(size=10, weight='bold', color='black'),
        axis_text_x=element_text(size=8, color='black'),
        axis_text_y=element_text(size=10, color='black'),
        axis_line=element_line(color='black', size=0.3),
        panel_border=element_rect(color='black', fill=None, size=0.3),
        plot_caption=element_text(size=10, weight='bold')
    ) +
    coord_flip()
)

print(plot)
Median H1B Recruiter Base Salaries by Job Title
The highest paid recruiters on H1B visa are generally those in management positions. When looking at median H1B salaries by job title, these definitely seem extremely low.
employer_summary = (
    df.groupby("job_title")
      .agg(
          N=("base_salary", "size"),
          median_base_salary=("base_salary", "median")
      )
      .reset_index()
)

employer_summary = employer_summary[employer_summary["N"] >10]

employer_summary = employer_summary.sort_values("median_base_salary", ascending=True)

employer_summary["job_title"] = pd.Categorical(
    employer_summary["job_title"],
    categories=employer_summary["job_title"],
    ordered=True
)

# Plot
plot = (
    ggplot(employer_summary, aes(x="job_title", y="median_base_salary", size="N")) +
    geom_point(alpha=0.7, color="steelblue") +
    labs(
        title="Median H1B Recruiter Base Salary by Job Title",
        x="",
        y="Median Base Salary (USD)",
        caption="www.mathewanalytics.com"
    ) +
    ylim(0, 250000) +
    theme(
        plot_title=element_text(size=12, weight='bold', color='black'),
        axis_title_x=element_text(size=12, weight='bold', color='black'),
        axis_title_y=element_text(size=10, weight='bold', color='black'),
        axis_text_x=element_text(size=8, color='black'),
        axis_text_y=element_text(size=10, color='black'),
        axis_line=element_line(color='black', size=0.3),
        panel_border=element_rect(color='black', fill=None, size=0.3),
        plot_caption=element_text(size=10, weight='bold')
    ) +
    coord_flip()
)

print(plot)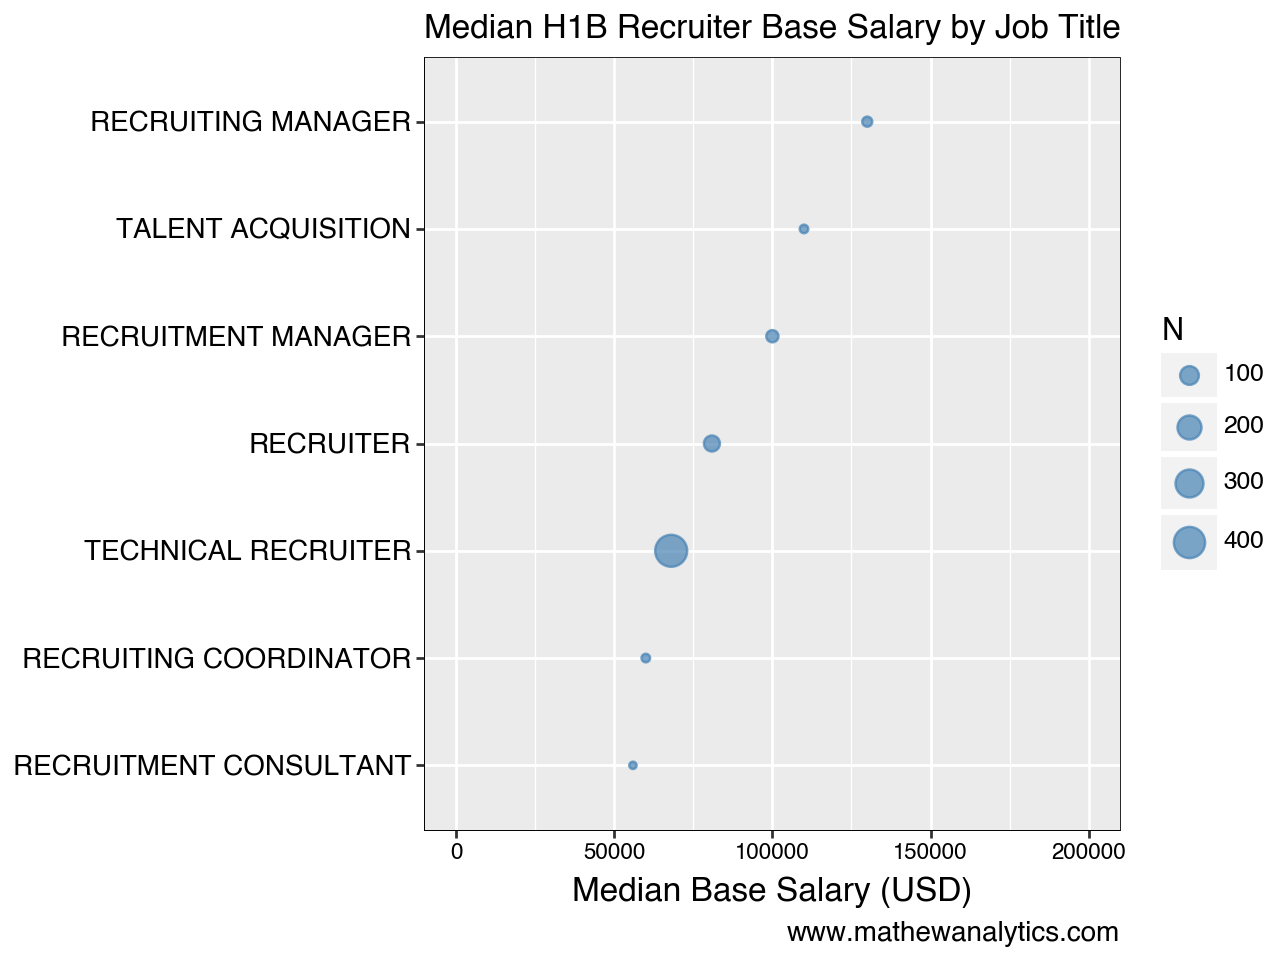
Conclusion
This dataset is extremely interesting. I’m very skeptical of anyone who would claim that there is a shortage of recruiters in America. Furthermore, I don’t see how the governent allows businesses to abuse these and other immigration programs to bring in people at such low salaries.
In future posts, I’ll dig in deeper into other H1B salary for particular companies and job titles.
